Measuring the success of Digital Out-of-Home (DOOH) advertising uses a mix of classic marketing indicators and modern digital tracking tools. Unlike static billboards, DOOH gives very detailed data for tracking and improving campaigns. Advertisers can move past simple exposure numbers and look at real engagement and actions.
Knowing who saw an ad, when they saw it, and what they did afterward brings DOOH closer to the accuracy of online ads and makes it a key part of many marketing plans today. If you want to learn more about effective DOOH campaigns, solutions such as DOOH advertising BE Media can offer useful ideas and tools. As a leader in digital outdoor solutions, BE Media provides comprehensive DOOH strategies that deliver measurable results.
What Is DOOH Advertising and Why Measure Its Success?
Digital Out-of-Home advertising means digital screens in public places that show changing content. Examples include digital billboards, screens in buses and trains, and displays in shops or malls. This fast-growing channel reaches people while they are out and about, giving brands a way to speak to many different groups in different situations. Because DOOH content and targeting can change in real time, it can have a bigger impact than traditional out-of-home formats.
Measuring DOOH success is needed to prove how marketing budgets are used and to improve campaign results. Today every marketing dollar has to show clear output, so broad, old-fashioned guesses are no longer enough. Thanks to technology, real-time data, and better targeting, DOOH now offers detailed insights that old OOH campaigns could not provide. This move from rough estimates to hard numbers helps make DOOH campaigns both eye-catching and strategically effective.
Why Is Campaign Measurement Critical for DOOH?
Campaign measurement is key for DOOH because it changes the channel from something used mainly for awareness into a strong driver of many goals, from brand lift to direct sales. In the past, measuring OOH impact was difficult and often based on simple reach estimates or gut feeling. With digital screens, this has changed. Marketers can now use indicators and Key Performance Indicators (KPIs) similar to those in online campaigns.
By tracking and analyzing results, advertisers can make decisions based on data, manage budgets better, and show clear Return on Investment (ROI) to decision-makers. They can see if an ad is reaching the right people, getting enough exposure, and most importantly, leading to the actions they want. Without strong measurement, DOOH would still be a “wild card” that is hard to justify in a marketing mix that is more and more data-driven.
Key Metrics and KPIs for DOOH Advertising Success
Knowing which metrics to track is key for running any ad campaign well, and DOOH is no different. These numbers help advertisers and media buyers see how campaigns are doing, check if ads reach the right people, and see how much engagement or how many conversions they drive. As DOOH has grown, especially with programmatic buying, it now offers more advanced metrics that show how audiences act and react in real time.
Impressions and Cost Per Thousand Impressions (CPM)
Impressions are one of the basic metrics for DOOH. They show how many times an ad could have been seen. DOOH is a “one-to-many” format: one play of an ad on a public screen can be seen by many people at once. To reflect this, media owners use an “impression multiplier” for each play of an ad on a screen to estimate how many people may have seen it.
Impressions are usually estimated using traffic counts, sensors, and audience tools like GPS data or camera-based measurement. For example, if 100,000 vehicles pass a billboard each day, with an average of 1.5 people in each car, the daily impressions would be about 150,000. These numbers matter both for reporting results and for pricing. The impression multiplier helps make CPM calculations more accurate, taking into account changes in audience flow during the day, such as higher traffic at rush hour.
Cost Per Thousand Impressions (CPM) shows how much an advertiser pays for every 1,000 impressions of a DOOH ad. The formula is: (Cost of Ad / Number of Impressions) * 1000. If an ad costs $5,000 and gets 500,000 impressions, the CPM is $10. CPM helps advertisers compare DOOH with other channels and split budgets in a way that makes sense, choosing screen locations that offer the best value. A lower CPM with high impressions usually means better cost-effectiveness and more exposure for the money spent.
Reach and Frequency
Impressions show total possible views, but reach and frequency explain how that exposure is spread across different people. Reach is the number of unique people who see the ad at least once. It answers, “How many different people saw my ad?” Reach comes from total impressions by separating repeat views from first-time views. If a screen is passed by 500,000 different people in a week, weekly reach is 500,000.
Frequency shows how many times, on average, each of those people saw the ad. It is calculated as total impressions divided by reach. If an ad has 1,000,000 impressions and reaches 250,000 people, frequency is 4. Reach and frequency help balance exposure. Too few views can mean poor recall; too many can annoy viewers and cause “ad fatigue.” Advertisers adjust their schedules using these two metrics so their messages are seen by enough people often enough-without overdoing it.
Engagement and Interactivity Metrics
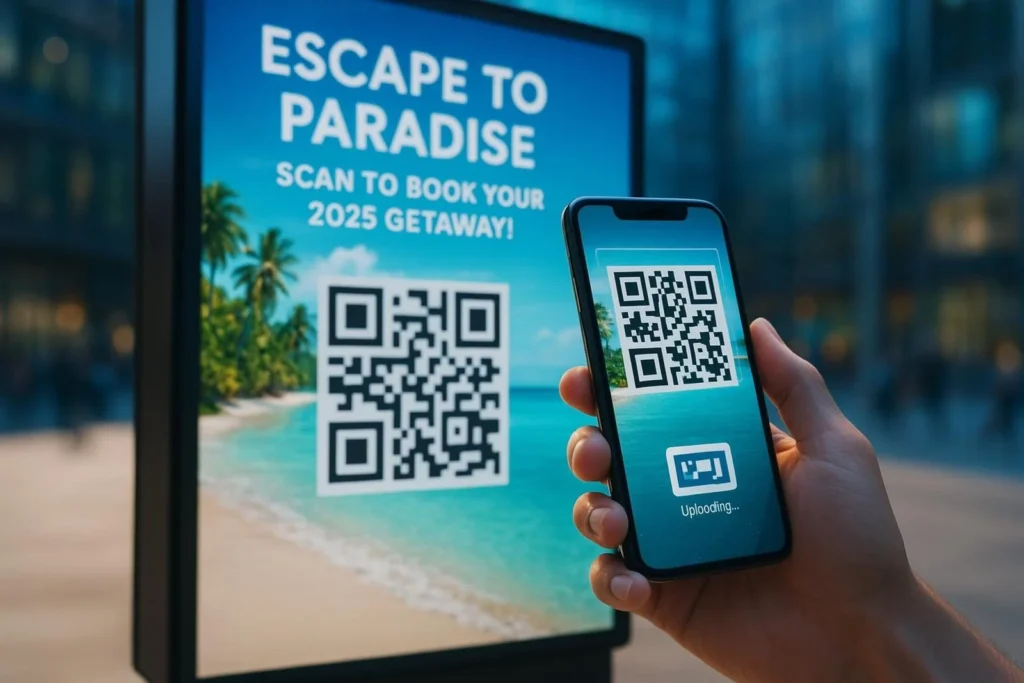
Engagement metrics in DOOH measure how people interact with an ad, instead of just walking past it. This is one of DOOH’s strong points. Engagement can be actions like scanning a QR code, tapping a touchscreen, linking to an app, or interacting via social media. If an ad with a QR code gets 500 scans from 50,000 impressions, the engagement rate is 1%.
These metrics are especially helpful when a campaign aims for direct response. Sensors, cameras, apps, and touchscreens all supply clear data points. By tracking engagement closely, advertisers can see how well an ad holds attention and encourages action, helping move people along the marketing funnel. Adding interactive elements on DOOH screens also makes the experience more active and responsive.
Dwell Time and Audience Attention
Dwell time shows how long, on average, people stay within view of a DOOH ad and pay attention to it. It is a strong indicator of how interesting and attention-grabbing your creative and message are. Longer dwell times usually mean higher engagement. Technologies like sensors, cameras, anonymous mobile data, and even eye-tracking can be used to measure this.
Still, context matters a lot for dwell time. An interactive screen at a bus stop, where people naturally have to wait, will usually have longer dwell times than a roadside billboard viewed by people driving past. Advertisers use dwell time data to improve message length, visuals, and placement. The aim is to show strong creative in places where the audience is likely to spend enough time for the message to land.
Attribution and Conversion Rate
Attribution and conversion rate show how DOOH ads lead to real business results. Conversion rate is the share of people who take a wanted action after exposure to an ad. That action might be a purchase, sign-up, app download, or website visit. Conversion rate is calculated as conversions divided by impressions or interactions. For instance, if 200 people buy after seeing an ad out of 500,000 impressions, the conversion rate is 0.04%.
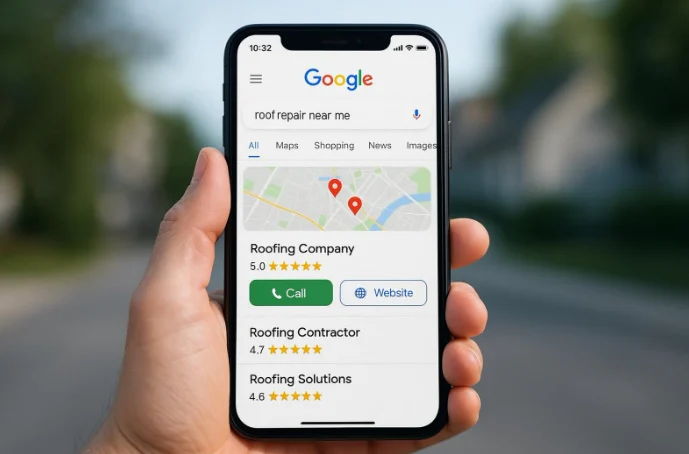
Attribution methods connect those conversions back to ad exposure, which is especially hard in journeys involving many touchpoints. Advanced tools, device ID matching, and geo-fencing help link ad views to later behavior. For example, if someone visits a store or searches for a brand after walking past a screen, that action can be tied back to the DOOH ad. This lets marketers see clearly how DOOH affects behavior and sales, both online and offline. A common way to check success is to compare sales before and after the campaign period and combine that with attribution data.
Brand Lift Studies and Surveys
Brand lift studies measure how DOOH affects awareness and brand perception at the top of the funnel. They compare people who saw the ad with people who did not. Surveys with both groups show the difference, or “lift,” in metrics like ad recall, brand awareness, consideration, favorability, and purchase intent.
These studies work well for launches, seasonal campaigns, and rebrands where the aim is to build recognition and positive feeling. By asking real consumers for feedback, brands see how well the ad message worked. Pre- and post-campaign surveys, often by outside research partners, give an unbiased view of impact on brand health, even when the main goal is awareness rather than direct sales.
Foot Traffic and Store Visit Attribution
For brands with physical sites-shops, restaurants, venues-foot traffic and store visit attribution are key numbers. They show how DOOH campaigns lead to actual visits. Using anonymous mobile IDs, geo-fencing, and location data firms, advertisers can tie ad exposure to movement patterns and store entries.
This helps brands see how many people who passed a DOOH ad later visited a set store or site. Platforms like Adsquare use custom shapes (polygons) and radiuses to define areas and measure visits in a very focused way. Foot traffic insight is especially useful for campaigns that aim to drive sales at nearby stores, push visits for new openings, or boost tourism. By matching visits to screens, advertisers can pick better locations and creatives that draw more people into real-world locations.
Methods and Technologies Used to Measure DOOH Campaign Effectiveness
As DOOH moved from static prints to digital screens, measurement tools also grew more advanced. What once depended on rough calculations is now powered by detailed data and modern tech. Marketers can now look closely at performance and improve DOOH at each stage of the customer path.
Audience Measurement Tools and Platforms
Special audience measurement tools and platforms have been built to answer the core questions: who saw an ad, when did they see it, and for how long? Platforms like Quividi and Linkett work with cameras and sensors on DOOH screens to gather real-time view data, including dwell time and engagement. At the same time, research firms like Geopath and Nielsen use statistical methods to estimate likely views across large OOH networks.
Geopath, a non-profit group, audits outdoor inventory and offers detailed impression numbers using pedestrian counts, traffic volumes, and vehicle occupancy rates. This lets them estimate what share of people actually notice an ad. These tools matter for checking audience size and confirming that campaigns reach the right people in the right areas. They also offer dashboards and near real-time reports so brands can follow results and adjust quickly.
Programmatic DOOH Measurement and Real-Time Data
Programmatic DOOH (pDOOH) brings the automation and targeting of online advertising to DOOH. It automates buying and shows detailed performance data. Unlike older OOH buying that used broad reach assumptions, pDOOH uses real-time inputs and audience insights for more accurate measurement.
Platforms like Google Display & Video 360 (DV360) let advertisers run and track programmatic DOOH campaigns while pulling data from multiple ad exchanges. They provide live analytics, including impressions and audience segments. This real-time view allows for dynamic creative optimization (DCO) and quicker changes to targeting and placements. With up-to-date data on exposure and engagement, DOOH becomes a flexible, measurable medium, not a fixed buy.
Device ID and Mobile Location Data for Attribution
Using mobile device IDs and location data is one of the most advanced ways to measure DOOH. Since most people carry smartphones with location services on, anonymized data can show how they move during the day. Advertisers can use this to see how many people pass an ad and what they do afterward.
With tools like Device ID Passback, advertisers get anonymized IDs of devices that were exposed to DOOH ads. They can then retarget these same users on mobile, display, CTV, social, or audio channels, extending the impact of DOOH across other media. Location data also reveals how many ad-exposed devices later appeared inside a store, making it possible to directly tie visits to DOOH screens. This helps brands see which locations and formats bring the best returns and how DOOH fits into a full-funnel, omnichannel strategy.
Cross-Channel and Omnichannel Impact Metrics
Modern DOOH works best when connected to other channels. Data from pDOOH can join offline exposure with online behavior, giving a more complete view of the journey. That includes seeing how DOOH affects clicks, searches, visits, and sales in other channels.
Key cross-channel indicators include:
- Walk-in rates: how many exposed users later enter a store (via location data)
- Online conversion rates: how many site visitors convert after DOOH exposure
- Cross-device conversions: conversions on other devices linked back to DOOH views
- Social media interactions: spikes in posts, likes, or shares from people near DOOH locations
Multi-touch attribution models give DOOH part of the credit when conversions happen after several media contacts. This helps marketers see DOOH not as an isolated line item, but as a channel that strengthens the whole media mix.
Dynamic Creative Optimization (DCO) Metrics
Dynamic Creative Optimization lets marketers change DOOH content automatically based on real-time inputs such as weather, time, nearby events, or audience profile. Elements like images, copy, offers, and calls-to-action can be adjusted on the fly. For example, a fast-food brand might show coffee and breakfast in the morning, then burgers at lunch, or change creative when it starts raining.
To see how well DCO is working, advertisers track specific metrics, such as:
- CTR or interaction rate by creative variant (for example, QR scans per version)
- Engagement with creative elements (which layouts, colors, or messages get more responses)
- Performance by condition (time of day, weather, location type)
- Creative rotation impact (which combinations work best over time)
These numbers show which versions drive more attention and conversions, helping teams keep improving their dynamic rules and templates.
How to Analyze and Improve DOOH Advertising ROI
Looking at Return on Investment (ROI) for DOOH helps marketers prove the value of their campaigns and improve them over time. With today’s tools, DOOH is far from a “spray and pray” approach. Results can be tracked, studied, and improved step by step. The key is to read the data in the right way and turn it into clear actions.
Calculating ROI for DOOH Campaigns
Working out ROI for DOOH is more than just comparing ad spend with revenue. A simple “before and after” sales check can give a general idea, but it often lacks detail. A better method brings in different KPIs and attribution models to link exposure to outcomes.
The basic ROI formula is (Net Profit / Cost of Investment) * 100%. For DOOH, “Net Profit” can include direct sales traced through conversion tracking, extra website visits, more app installs, or an estimated value of higher brand awareness or recall. Advanced models use geo data and AI to link DOOH exposure with later actions. For example, if a $10,000 campaign leads to $50,000 in tracked sales, ROI is 400%. By looking at all relevant returns, marketers get a clearer picture of the real value of DOOH.
Optimizing Creative and Media Placement
Once you have data from a DOOH campaign, the next step is to use it to improve both creative and placement. For creative, A/B testing different versions shows which images, offers, formats, or calls-to-action work best. DCO data, for instance, can show how results change when creative adapts to weather or time. If one layout or message keeps leading to more QR scans or visits, it makes sense to focus budget there and test further variations.
For placement, performance data reveals which screens, venues, and neighborhoods deliver the best outcomes against your goals. Foot traffic studies and mobile data highlight locations that drive strong store visits or online conversions. Underperforming screens may need a different creative, a new schedule, or lower investment, while strong performers can receive more budget. With programmatic buying, these changes can often be made quickly, helping ads run more often in places and times that bring the best results.
Using Data Insights to Guide Future Campaigns
The main reason to measure DOOH carefully is to learn from every campaign. Whether a campaign beats expectations or not, it offers data that can improve the next one. By looking closely at impressions, reach, dwell time, engagement, conversion rates, and brand lift, marketers can spot trends and learn what really works with their audience.
This learning helps refine targeting, messaging, formats, and budget splits. For example:
- If a certain demographic responds very well in a specific area, future campaigns can focus more there.
- If an interactive feature regularly drives high conversions, it can be reused and improved in later creatives.
- If DOOH exposure is often followed by more searches or social mentions, the brand can plan search and social campaigns to work in sync with DOOH.
Over time, this cycle of testing and learning makes DOOH more efficient and raises ROI, turning it into a stable, data-backed part of the media plan.
Best Practices for Tracking and Reporting DOOH Performance
To get the most value from DOOH, marketers need a clear process for tracking and reporting. This means planning ahead, choosing the right tools, and keeping data clean and honest. Good habits in these areas help prove value to stakeholders and keep improving future campaigns.
Setting Clear Objectives and Benchmarks
Strong tracking starts with clear, measurable goals before any ads go live. Without clear targets, judging success is almost impossible. Goals should be SMART: Specific, Measurable, Achievable, Relevant, and Time-bound. For example:
- “Increase brand awareness by 15% among 18-34-year-olds in downtown districts within three months.”
- “Raise visits to our new store by 10% within one month of launch.”
Next, choose KPIs that match these goals. For awareness, focus on impressions, reach, and brand lift metrics from surveys. For conversion, pay more attention to engagement rate, foot traffic, and online conversion rate. Setting benchmarks-what counts as acceptable, good, or excellent performance-gives teams a reference point and helps guide optimization.
Choosing the Right Measurement Tools for Your Campaigns
There are many DOOH measurement tools available, so it is important to pick the ones that best match your aims. For real-time audience data and engagement tracking, platforms like AdMobilize or Quividi use AI and sensors to capture information about demographics, dwell time, and interactions. For location and visit attribution, tools like PlaceIQ or Foursquare Places use mobile location data.
For programmatic DOOH, connecting with DSPs like DV360 gives you strong measurement and cross-channel reporting. For brand lift, mobile survey platforms such as MFour can reach specific audiences and collect feedback. End-to-end platforms like Confirm bring together impression tracking, audience insight, and conversion data into one dashboard. The main point is to align your tools with your goals so that the data you collect helps you answer the questions that matter most for your campaign.
Ensuring Data Accuracy and Transparency
High-quality data and open reporting are the basis of trustworthy DOOH measurement. With many input sources-traffic numbers, sensors, mobile data, third-party surveys-marketers must check that the data is correct and collected in a reliable way. This includes working with reputable partners that use strong methods and follow accepted industry practices. Organizations like Geopath help by auditing inventory and providing verified impression numbers.
Transparent reporting means clearly explaining how numbers like impressions are calculated, including any multipliers used. Advertisers should have access to detailed dashboards that show performance by screen, number of plays, and effective CPM. This level of detail supports better decisions and makes it easier to adjust campaigns confidently. It also builds trust between brands, agencies, and media owners.
Future Trends and Innovations in DOOH Success Measurement
DOOH and its measurement tools continue to change quickly. As technology moves forward, advertisers gain more detailed tracking, better attribution, and stronger planning tools. These shifts will strengthen DOOH’s position as a measurable and effective channel.
Advances in Real-Time Analytics and AI
Artificial Intelligence (AI) and machine learning are set to upgrade real-time analytics in DOOH. AI can improve planning, forecasting, and reporting by delivering live audience and behavior updates. That means better modeling of key indicators and more accurate audience estimates, which can be used to show the right message at the right time and place.
With AI-driven insights, creative can adjust instantly based on traffic, weather, or audience type. Predictive analytics will help marketers estimate campaign performance before and during the run and change tactics early if needed. Tools like The Neuron already provide live OOH analytics, showing how AI can support faster and smarter optimization.
Evolving Industry Standards and Third-Party Verification
As DOOH measurement grows more advanced, strong standards and independent checks become more important. Shared standards help keep definitions and methods consistent, making it easier to compare results across networks and platforms. Groups like Geopath already standardize and audit impression data and will likely play an even bigger role as data gets more complex.
Future progress will likely include common measurement frameworks that combine data from many sources into a single, trusted view. Independent verification will help validate proprietary models and keep providers accountable. This will make DOOH results easier to compare with other digital channels and help brands fit DOOH smoothly into full-funnel, omnichannel plans backed by clear proof of performance.